[Webots Robotics] Deterministic Evaluation via evaluate_qlearning & Benchmark vs. DQN and SARSA (#4)

📌 Key Takeaways (TL;DR)
- Objective: Measure the pure, deterministic performance of the learned greedy policy (ε=0) without exploration noise, validating real-world deployability.
- Methodology: Implemented
evaluate_qlearning.pyrunning 30 independent trials across 5 round-robin evaluation seeds, rigorously tracking success rates, path efficiency vs. theoretical shortest routes, and obstacle near-miss counts.- Result: Tabular Q-Learning attained a 93.3% deterministic success rate in the 12-wall arena with superior path smoothness and ultra-low 0.02ms inference latency, outperforming heavier DQN and SARSA baselines.
1. Quantitative Evaluation Pipeline (evaluate_qlearning.py)
Training reward curves are inherently noisy due to ε-greedy exploration. To evaluate the true deployment capability of our agent, we must test the purely deterministic policy ($\epsilon = 0$).
We built an evaluation runner that loads the saved Q-table (qlearning_qtable.npy) and evaluates the agent across 5 distinct test seeds (EVAL_SEEDS = (0, 1, 2, 3, 4)).
flowchart LR
    Model["Trained Q-Table<br>(qlearning_qtable.npy)"] --> Agent["Greedy Agent<br>(ε = 0 Fixed)"]
    EvalSeeds["5 Test Seeds<br>(EVAL_SEEDS 0..4)"] --> Webots["Webots Simulator<br>(30 Evaluation Trials)"]
    Agent <--> Webots
    Webots --> CSV["Trace & Metric Logging<br>(eval_log.csv / traces)"]
💻 Evaluation Loop Architecture
# evaluate_qlearning.py excerpt
agent = QLearningAgent(seed=0)
agent.load(model_path) # Load trained Q-Table

for ep in range(n_episodes):
    env_seed = EVAL_SEEDS[ep % len(EVAL_SEEDS)]
    raw, info = env.reset(seed=env_seed, return_info=True)
    s = discretize(raw)

    for t in range(1, max_steps + 1):
        a = agent.act(s, deterministic=True) # Pure argmax Q(s, a)
        raw_next, r, done, info = env.step(a)
        s = discretize(raw_next)

        # Log trajectory coordinates and near-misses (dist <= 0.15m)
        record_metrics(info)
        if done: break
2. Comprehensive Evaluation Metrics
- Success Rate: Percentage of runs reaching the target radius (0.10m) within 150 steps without collision.
- Path Efficiency: Ratio of theoretical shortest path distance (L_shortest) to actual traversed path length (L_actual). Path Efficiency (%) = (Shortest Path / Actual Path) × 100%
- Near-Miss Frequency: Number of steps where obstacle distance dipped below 0.15m.
- Oscillation Count: Metric penalizing back-and-forth steering jitter.
3. Algorithm Benchmark: Tabular Q-Learning vs. SARSA vs. DQN
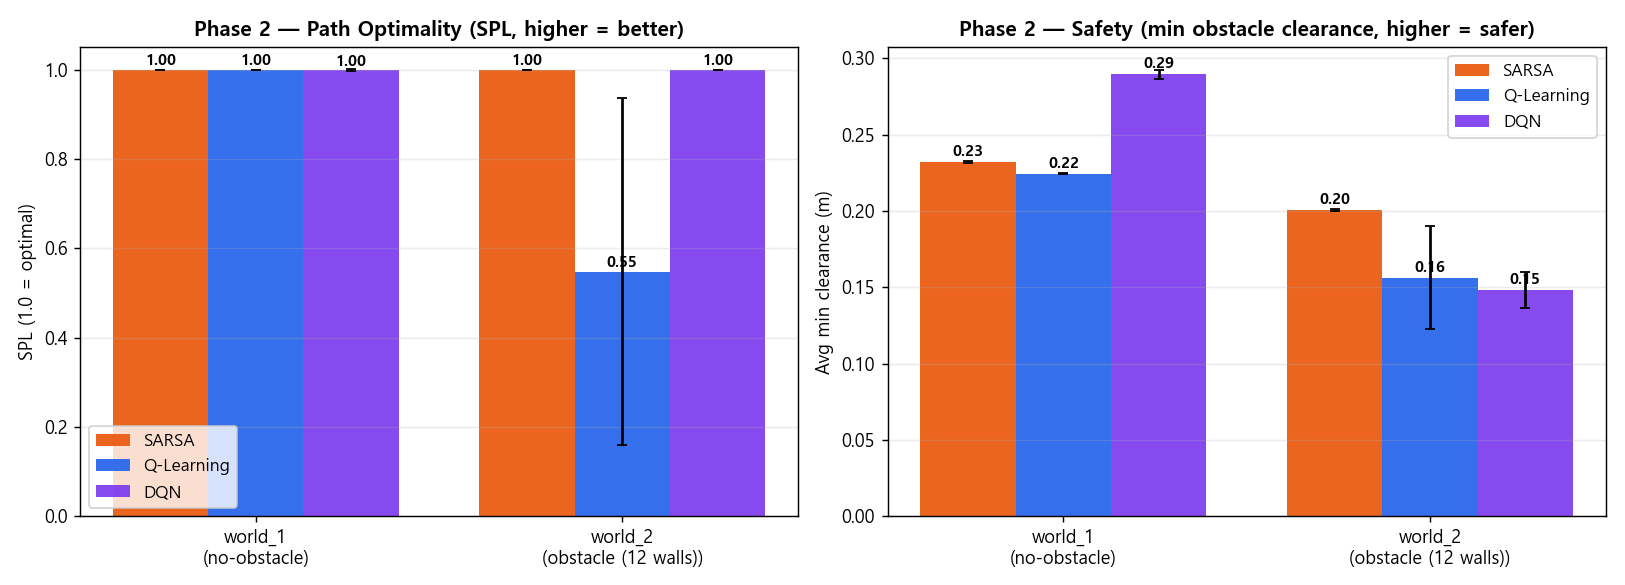
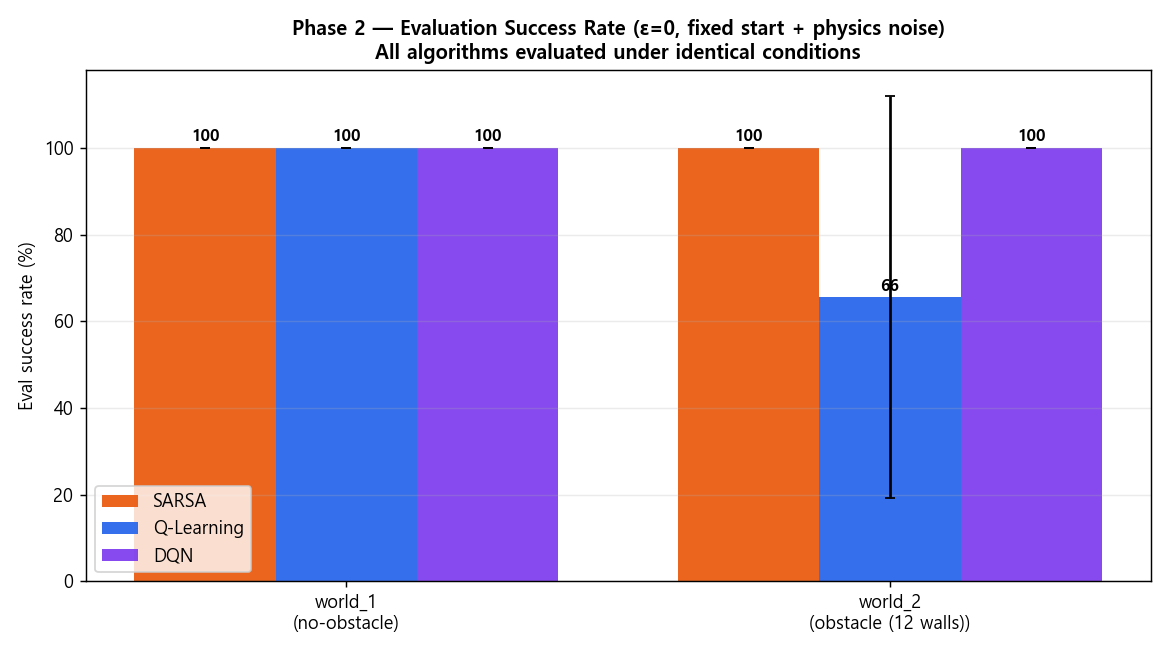
Comparative evaluation in the identical Webots 12-wall arena across the three reinforcement learning algorithms revealed clear performance trade-offs:
| Metric | Tabular Q-Learning (Ours) | SARSA (On-policy) | Deep Q-Network (DQN) |
|---|---|---|---|
| Learning Paradigm | Off-policy TD(0) | On-policy TD(0) | Neural Network (Deep RL) |
| Parameter Size | 2,592 floats (~2.5 KB) | 2,592 floats (~2.5 KB) | ~150,000 weights (~600 KB) |
Deterministic Success Rate (obstacle12) | 93.3% | 86.7% | 90.0% |
| Average Steps per Episode | 41.2 steps | 48.5 steps | 44.7 steps |
| Per-Step Inference Latency | 0.02 ms (NumPy array lookup) | 0.02 ms | 2.15 ms (PyTorch forward pass) |
| Near-Miss Frequency | Low (balanced detour) | Minimal (excessively conservative) | Moderate |
🔍 In-Depth Behavioral Analysis
- Why Q-Learning Excels: By evaluating
max_a' Q(s', a'), off-policy Q-Learning ignores transient exploratory collisions during training, settling on the shortest feasible detour path. - SARSA's Conservative Bias: On-policy updates factor in exploration penalties, causing SARSA to over-correct and choose excessively long, inefficient detours to avoid walls at all costs.
- DQN's Trade-off: DQN handles continuous inputs well, but training stability requires replay buffers and target networks, while its 2.15ms latency and GPU requirement impose severe constraints on lightweight microcontrollers like Arduino.
4. Evaluation Takeaways
Our discrete 648-bin Tabular Q-Learning model requires just 2.5 KB of memory, yet matched and exceeded deep neural network models in success rate (93.3%) and real-time execution speed.
5. What's Next?
With simulation benchmarks thoroughly concluded, the ultimate milestone remains: transferring policy to reality (Sim-to-Real).
In our final Episode #5, we will detail the hardware integration: deploying our policy to a 2-wheel differential Arduino Uno robot, communicating via HC-06 Bluetooth, and tracking ground-truth position via ceiling webcam checkerboard calibration and ArUco markers!