[Stanford CS146S #6] AI-Assisted Debugging & Runtime Profiling: Leveraging eBPF, Dynamic Tracing, and LLMs for Incident Mitigation

Welcome to Lecture 6 of our deep-dive series covering Stanford University’s CS146S: The Modern Software Developer.
In our preceding lecture, we explored multi-agent swarm orchestration—coordinating Architect, Implementer, and Critic LLMs through structured DAG workflows to write massive modular codebases. Yet, even the most rigorously tested software eventually encounters the chaotic crucible of production.
At 3:00 AM, when an obscure concurrency deadlock freezes a distributed payment cluster or an unindexed database query causes tail latency to spike to 12 seconds, traditional developer debugging workflows collapse. Static analysis cannot predict dynamic race conditions, invasive printf debugging introduces the Heisenbug effect (altering timing and masking the bug), and distributed APM tracing tools drown Site Reliability Engineers (SREs) in gigabytes of unstructured log noise.
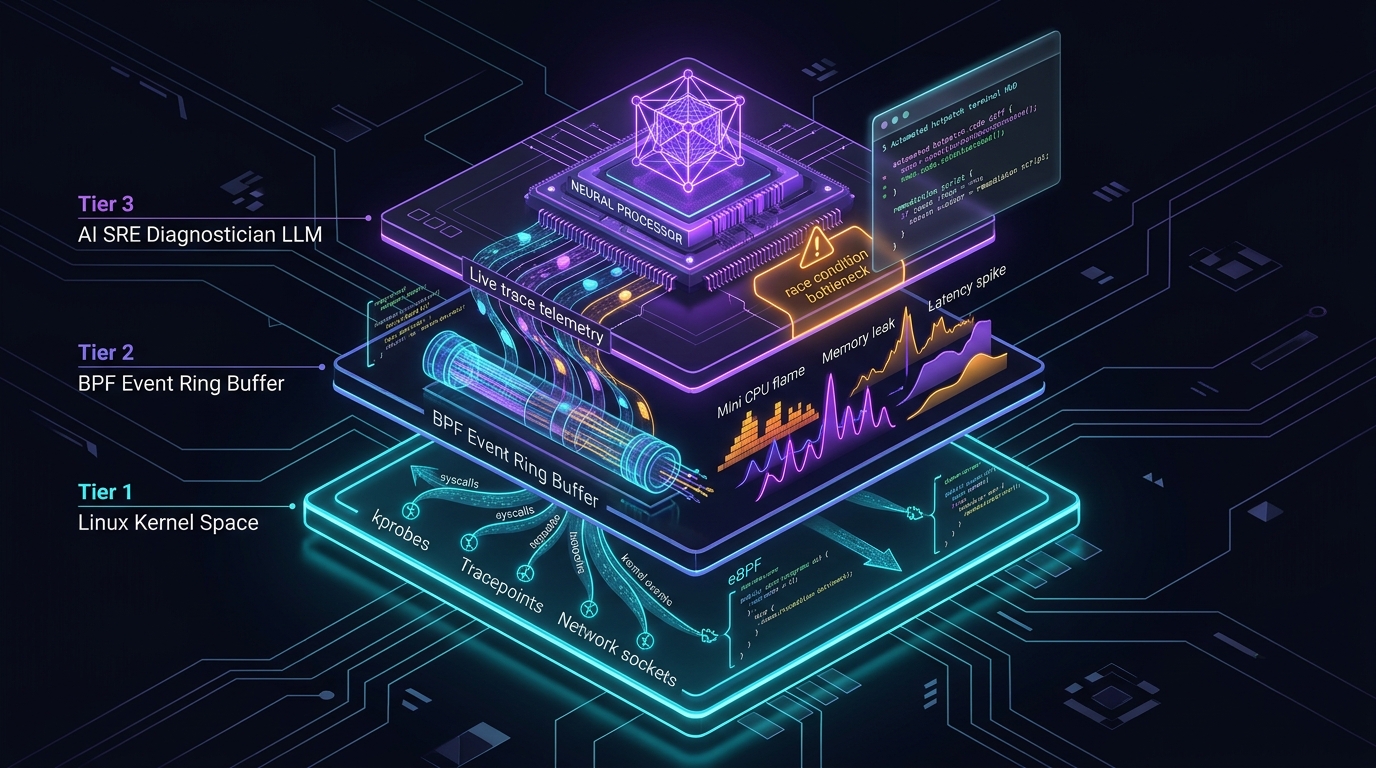
In today's lecture, Stanford faculty unveil the next frontier in autonomous software resilience: AI-Assisted Debugging & Runtime Profiling. By combining the zero-overhead, non-intrusive power of extended Berkeley Packet Filters (eBPF) with specialized LLM Diagnostic SRE Agents, modern engineering teams can capture kernel-level execution states in real-time, perform automated root-cause identification, and synthesize hotfixes in minutes rather than hours.
1. The Production Incident Crisis: Why Traditional Debugging Fails
When high-throughput microservices fail under load, software engineers face three fundamental observability paradoxes:
flowchart TD
    subgraph Traditional_Failure ["The Failure Modes of Traditional Production Triage"]
        A1["Invasive Print / Debugging Hooks"] --> A2["Heisenbug Effect: Timing changes, bug disappears under instrumentation"]

        B1["Distributed APM & Log Aggregation"] --> B2["Log Blindness: Millions of JSON lines/sec drown the critical root-cause trace"]
        B2 --> B3["Context Saturation: Humans cannot correlate cross-pod thread states"]

        C1["Post-Mortem Core Dumps"] --> C2["High Downtime: Service must crash completely to capture memory state"]
        C2 --> C3["Zero Runtime Mitigation: Customers experience outage during triage"]
    end

    subgraph AI_eBPF_Solution ["Stanford CS146S Paradigm: Zero-Overhead AI SRE"]
        D1["Kernel-Level eBPF Probes"] --> D2["Zero-overhead non-intrusive bytecode tracing"]
        D2 --> D3["LLM SRE Engine: Automated causal graph synthesis & hotpatching"]
    end
- The Heisenbug Dilemma: Injecting logging code or attaching interactive debuggers (
gdb,lldb) pauses threads, shifts lock acquisition order, and dilutes CPU caches, frequently making elusive race conditions vanish during investigation. - Telemetry Deluge vs. Semantic Blindness: Modern observability pipelines collect petabytes of metrics, traces, and logs. However, when an incident triggers 45 cascading alerts simultaneously, engineers waste hours determining which alert is the primary cause and which 44 are downstream symptoms.
- The Semantic Gap Between Kernel and Application: High-level application metrics (e.g., "HTTP 504 Gateway Timeout") offer zero visibility into whether the root cause is thread pool starvation, TCP socket buffer bloat, or dirty page flushing blockages inside the Linux VFS layer.
2. The eBPF Revolution: Non-Intrusive Kernel Observability
To solve the Heisenbug problem, Stanford CS146S leverages eBPF (extended Berkeley Packet Filter). eBPF is a revolutionary Linux kernel technology that allows developers to run sandboxed, verified programs directly within the operating system kernel without modifying kernel source code or loading dangerous kernel modules.
flowchart TD
    subgraph UserSpace ["User Space (Applications & Containers)"]
        AppNode["Payment Microservice Node.js / Go"]
        AIDaemon["AI SRE Diagnostic Daemon (Python / LLM)"]
    end

    subgraph KernelSpace ["Linux Kernel Space (Zero Overhead)"]
        Kprobe["kprobe: sys_enter_write / sys_enter_futex"]
        Tracepoint["tracepoint: sched_switch / tcp_retransmit"]
        RingBuffer["eBPF BPF_MAP_TYPE_RINGBUF<br/>(Lockless Per-CPU Event Streaming)"]

        Kprobe & Tracepoint -->|Microsecond Telemetry| RingBuffer
    end

    RingBuffer -->|Zero-Copy DMA Read| AIDaemon
    AIDaemon -->|Root-Cause Analysis & Action Plan| Engineer["SRE Incident Commander"]
    AIDaemon -->|Optional Automated Hotpatch| AppNode
Why eBPF is Essential for AI Debugging:
- Zero Overhead: eBPF programs are JIT-compiled into native machine instructions with strict safety verification (guaranteed loop termination, zero invalid memory access), imposing less than 1.5% CPU overhead under full line-rate traffic.
- Universal Observability: By attaching hooks to
kprobes(kernel function entries),kretprobes(kernel function exits),uprobes(user-space application symbols), and socket filters, eBPF observes every system call, lock contention event, and network packet across all containers simultaneously. - Lockless Ring Buffers: High-frequency kernel events are streamed to user space through lockless per-CPU ring buffers (
BPF_MAP_TYPE_RINGBUF), preventing tracing overhead from degrading application throughput.
3. Bridging the Semantic Gap: Feeding Low-Level Traces to LLM Diagnostic Agents
Feeding raw eBPF traces (millions of hexadecimal pointers and nanosecond timestamps) directly into an LLM context window will instantly cause context exhaustion and token hallucination.
Stanford CS146S formalizes a Two-Stage Telemetry Distillation Engine:
- Deterministic Aggregation & Flame-Graph Folding:
- The user-space daemon aggregates call stacks into weighted folded formats (e.g.,
process;thread;function_A;function_B;futex_wait 450ms). - Differential analysis compares healthy baseline trace distributions against incident window distributions to extract statistical anomalies.
- The user-space daemon aggregates call stacks into weighted folded formats (e.g.,
- Causal Graph & Hypothesis Generation:
- The LLM receives structured, pre-filtered diagnostic inputs: the anomaly delta, the affected microservice source code, and the current Kubernetes pod status.
- Using Chain-of-Thought (CoT) diagnostic prompting, the LLM maps low-level kernel blockages back to application logic (e.g., identifying that an unclosed database connection pool is blocking on thread mutex locks).
4. Implementation: Building an eBPF Latency Tracer & LLM Remediation Pipeline
Below is a production-grade implementation of an eBPF slow-system-call tracer coupled with an asynchronous LLM incident mitigation engine:
# ebpf_ai_debugger.py - eBPF Observability & AI Diagnostic SRE Pipeline
import asyncio
import json
from bcc import BPF
from pydantic import BaseModel, Field
from typing import List, Optional

# 1. C-based eBPF Kernel Probe Program
EBPF_PROGRAM = """
#include <uapi/linux/ptrace.h>
#include <linux/sched.h>

struct event_t {
    u32 pid;
    u64 latency_ns;
    char comm[TASK_COMM_LEN];
};

BPF_HASH(start_time, u32, u64);
BPF_PERF_OUTPUT(latency_events);

int trace_sys_enter_write(struct pt_regs *ctx) {
    u32 pid = bpf_get_current_pid_tgid() >> 32;
    u64 ts = bpf_ktime_get_ns();
    start_time.update(&pid, &ts);
    return 0;
}

int trace_sys_exit_write(struct pt_regs *ctx) {
    u32 pid = bpf_get_current_pid_tgid() >> 32;
    u64 *tsp = start_time.lookup(&pid);
    if (tsp == 0) return 0;

    u64 delta = bpf_ktime_get_ns() - *tsp;
    start_time.delete(&pid);

    // Only report slow system calls (> 50ms latency spike)
    if (delta > 50000000) {
        struct event_t evt = {};
        evt.pid = pid;
        evt.latency_ns = delta;
        bpf_get_current_comm(&evt.comm, sizeof(evt.comm));
        latency_events.perf_submit(ctx, &evt, sizeof(evt));
    }
    return 0;
}
"""

class IncidentRemediationPlan(BaseModel):
    root_cause: str
    culprit_function: str
    confidence_score: float = Field(ge=0.0, le=1.0)
    remediation_script: str
    mitigation_strategy: str

class AIDiagnosticEngine:
    def __init__(self, llm_client):
        self.llm = llm_client

    async def diagnose_and_mitigate(self, event_data: dict, source_context: str) -> IncidentRemediationPlan:
        prompt = f"""
        [INCIDENT DIAGNOSTIC ALERT]
        Kernel Telemetry: Process '{event_data['comm']}' (PID: {event_data['pid']})
        experienced a severe syscall stall: {event_data['latency_ms']:.2f} ms.

        Application Source Context:
        {source_context}

        Analyze the root cause (e.g., synchronous disk I/O blocking the event loop, thread deadlock).
        Output a structured JSON remediation plan containing root cause, affected function, and a mitigation patch.
        """
        response = await self.llm.generate_structured(prompt, schema=IncidentRemediationPlan)
        return response

class eBPFTelemetryMonitor:
    def __init__(self, ai_engine: AIDiagnosticEngine):
        self.bpf = BPF(text=EBPF_PROGRAM)
        self.bpf.attach_kprobe(event="__x64_sys_write", fn_name="trace_sys_enter_write")
        self.bpf.attach_kretprobe(event="__x64_sys_write", fn_name="trace_sys_exit_write")
        self.ai = ai_engine

    def handle_event(self, cpu, data, size):
        event = self.bpf["latency_events"].event(data)
        latency_ms = event.latency_ns / 1_000_000.0
        print(f"[ALERT] Slow write() syscall in {event.comm} (PID: {event.pid}) took {latency_ms:.2f}ms!")

        # Async trigger to LLM AI SRE
        asyncio.create_task(self.ai.diagnose_and_mitigate(
            event_data={"comm": event.comm, "pid": event.pid, "latency_ms": latency_ms},
            source_context="// Relevant application controller snippet..."
        ))

    def start_polling(self):
        self.bpf["latency_events"].open_perf_buffer(self.handle_event)
        print("[eBPF MONITOR] Kernel probes active. Monitoring production syscall latency...")
        while True:
            self.bpf.perf_buffer_poll()
5. Key Lecture Takeaways & Next Steps
- Non-Intrusive Observability is Paramount: Production debugging cannot rely on print statements or heavy profilers. eBPF provides zero-overhead, kernel-level ground truth.
- Deterministic Distillation Before LLMs: Always aggregate and normalize high-frequency trace streams into statistical anomalies and flame-graphs before sending them to LLM diagnostic agents.
- Closed-Loop SRE Autonomy: AI agents transform debugging from reactive post-mortems into active, real-time mitigation—detecting tail latency spikes and generating remediation patches in flight.
In Lecture 7, we will explore Code Review at Scale: AST-Aware Automated Linters, Security Taint Analysis, and Autonomous LLM PR Reviewers.
📌 3–5 Line Executive Summary
- The Production Debugging Crisis: Solved the Heisenbug effect and telemetry deluge by replacing invasive application-level logging with non-intrusive eBPF kernel tracing.
- Zero-Overhead Kernel Telemetry: Deployed sandboxed eBPF bytecode hooks (
kprobes,tracepoints) with lockless ring buffers, capturing microsecond-level system call stalls with under 1.5% CPU overhead. - Telemetry-to-LLM Distillation Engine: Filtered high-frequency kernel metrics into flame-graph anomalies and causal graphs, bridging the semantic gap between raw syscalls and application logic.
- Autonomous Incident Remediation: Architected an AI SRE pipeline that continuously digests eBPF telemetry, pinpoints root-cause race conditions, and synthesizes automated hotpatches to mitigate live production outages.
References & Stanford CS146S Materials
- Course: Stanford CS146S (The Modern Software Developer), Fall 2026.
- Instructors: Dept. of Computer Science, Stanford University.
- Related Technologies: Linux eBPF/BCC, bpftrace, Cilium, Pixie, OpenTelemetry, LangChain SRE Agents.